
Jon Mattes is the Director of Analytics and Development for DataDx. Jon has a passion for putting valuable data in the hands of decision-makers. He has spent nearly a decade using statistics and artificial intelligence to improve health outcomes and operational effectiveness across provider organizations of all sizes. He works with both clients and development partners to ensure DataDx is always at the cutting-edge of analytics and can provide each practice with the unique insights it needs to succeed. Jon received his Master of Science in Data Science from Northwestern University.
Contact Jon at: jmattes@datadx.hpamembers.com
Having a clear picture of your practice is only achievable through clean, consistent data. Incorrect values can easily be introduced into your system through hand-keying errors, data processing faults, or unknown software issues. These inconsistencies in your data can exist for years, causing significant reporting errors which can lead to poor decision-making.
How do you deal with this? How can you truly know what values are useful decision-drivers and which should be thrown out ?
Why Data Cleaning Is Important

What would happen if instead of the proper registration time being entered in a patient’s record, the hour and minute fields were left blank, causing them to default to zero ?
Now, this error is obvious to anyone looking at the small amount of data here, but what if you were analyzing 500,000 or a million records at once? This error might not be so obvious then. To show the effect of this error on data that size, I randomly generated 6,000 records per day for an entire quarter, with a mean of 30 minutes and a standard deviation of 5 minutes (Figure 1). I then added a single data point in the last day equal to our patient 003 example above (Figure 2). Take a look at how the Average Wait Time on September 30th is impacted in both examples (R code available at
https://github.com/DataDx/ArticleScripts/blob/master/data_integrity_article_code.R):
In statistics, there is a term called robustness, which is used to refer to an analysis that does not significantly change when some of its underlying assumptions are violated [1]. This is a desirable property because it means that even if your data does not exactly conform to its expected shape, you can still use the results of specific tests. However, as soon as values appear that are dramatically different than what is expected—called outliers or anomalies—this assertion of robustness can be violated [2]. This means that even your most basic statistical metrics can end up being misleading.
Think for example of a simple Average Wait Time metric. This is usually calculated by summing up the total wait times of patients within a certain time period and then dividing by the number of patients seen. Minden Medical Center in Minden, LA calculates each ER wait time by subtracting the patient registration time from the time the patient is first seen by a medical professional [3]. These would likely exist as two unique data points in a database, which would then be used by an analyst to create the Wait Time calculation.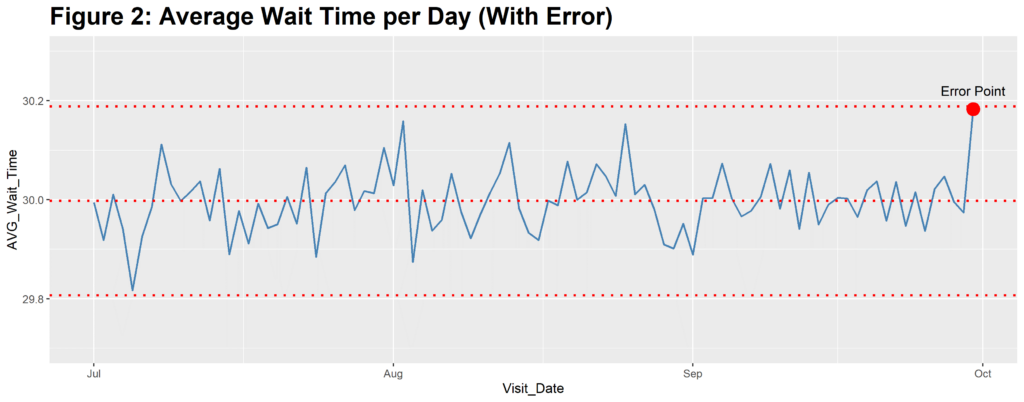
The value is clearly incorrect, but because there are so many other values being built into the average calculation, it merely looks like a slightly-larger-than-average value. In fact, even with a supposed wait time of over 13 hours, the average for the day doesn’t even cross our Six-Sigma Upper Control Limit line [4]. If the underlying error is not recognized, this increase could mistakenly be attributed to an underlying business problem, rather than a data problem.
These errors can easily be hidden when only using visualization techniques to analyze your data, which is why a proper anomaly-detection system that can automatically identify these issues is so important.
How Does Dirty Data Get Into Your System ?
Now that we know the impacts of failing to properly cleanse data, how can we keep it from happening in the first place? The real answer is you can’t. It’s impossible to foresee all potential data issues in the future and build airtight methods of dealing with them. However, once you know the ways dirty data gets into a system, you can build processes to minimize their potential.
The most common data issue tends to be incomplete data. This often results from records failing to be fully completed before submission. Generally, there are two ways of handling this type of error: removal or imputation. Removal is exactly what you would think: if a record does not have all the values that you need, you simply throw it out when performing the analysis. This is often the right choice, but there are some cases when you would be getting rid of other valuable data in the record by doing this, that’s where data imputation comes in. Data imputation is the process of filling in missing values with other values from the dataset, often the average or most common other value. This can be especially important when training machine learning models, which are greedy for as much data as you can give them. If you’re interested in learning more about missing data and imputation methods, here are a couple of resources you can check out:
- http://www.stat.columbia.edu/~gelman/arm/missing.pdf
- https://towardsdatascience.com/6-different-ways-to-compensate-for-missing-values-data-imputation-with-examples-6022d9ca0779.
Another common issue with data is extreme values, also known as outliers or anomalies. This is a much more difficult problem to deal with because you need to determine first if the values are legitimate, and second if they hold value for the analysis. If they are not legitimate (data entry or processing errors), you can safely wipe them and treat them as incomplete data. However, if they are legitimate, their usefulness is determined by both their cause and the type of analysis you are running. Thinking back to our wait times example from earlier, if one day the average patient wait time was over 10 hours, that would probably be extremely valuable information for the staff to know. However, if the reason they were waiting so long was because a tornado hit another hospital—causing a mass transfer of patients—its usefulness as a comparison point to other “normal” days would be low because of how unusual and unlikely to repeat the event was. In this case, removing the data point or truncating to the next-highest value would probably be more valuable for a long-term analysis.
How Do You Identify Dirty Data?
Most people use simple visualization techniques for identifying dirty data. It’s a simple, mostly effective method depending on the type of visualizations you use and the types of errors that you likely see. A histogram showing an extreme skew left or right, or a line chart showing one value dwarfing the rest can be a great way to identify these anomalies. However, as seen in our example, these can be unreliable methods, especially as the number of records analyzed begins to grow.
A better approach is to use a combination of rules and algorithms to flag likely outliers for further analysis automatically. There are a large number of these methods available, with most being highly technical. If you’re interested in learning more, here are some great resources to check out:
- https://machinelearningmastery.com/how-to-identify-outliers-in-your-data/
- https://scikit-learn.org/stable/modules/outlier_detection.html
- https://www.statisticshowto.datasciencecentral.com/find-outliers/ .
Data Cleaning with DataDx

The DataDx Anomaly Detection System utilizes advanced machine learning algorithms to identify inconsistencies in your data and highlight them for your team to investigate. DataDx does this by building a direct connection to your data source, meaning that your team never has to worry about submitting data themselves. During the onboarding process, and once again every quarter, a Data Integrity Report will automatically be generated for your practice, listing specific questionable values based on your historical data. All of this serves to increase the inherent value of your data by increasing its reliability and consistency. The DataDx Data Integrity Report highlights issues such as incorrect patient ages, uncharacteristically large transactions/journal entries, RVU entry errors, and much more. Reach out to DataDx to learn more about our proprietary DataDx Anomaly Detection System and DataDx Data Integrity Reports so that you can start trusting your data!
Referrence
1] Robust Statistics / Estimation (Robustness) & Breakdown Point. (2016, May 17). Retrieved December 6, 2019, from
https://www.statisticshowto.datasciencecentral.com/robust-statistics/.
[2] Osborne, J. W. (2013). Why Data Cleaning is Important. In Best Practices in Data Cleaning (pp. 3–8). Thousand Oaks, CA: Sage Publications, Inc.
[3] How our ER Wait Times are Calculated. (n.d.). Retrieved December 6, 2019, from
https://www.mindenmedicalcenter.com/how-wait-time-is-calculated.
4] Chitranshi, U. (2018, October 26). An Ultimate Guide to Control Charts in Six Sigma. Retrieved December 6, 2019, from
https://www.greycampus.com/blog/quality-management/an-ultimate-guide-to-control-charts-in-six-sigma .