Operational Insights
for Dental Practices
DataDx gives you total clarity on
your workload and productivity
But what if you could have that level of insight and a team of strategists that can help you identify opportunities, define goals, set priorities, and create a system of accountability that would make you more profitable than ever?
Your team deserves clarity. And so do you. That’s precisely what DataDx provides.
Provider Productivity
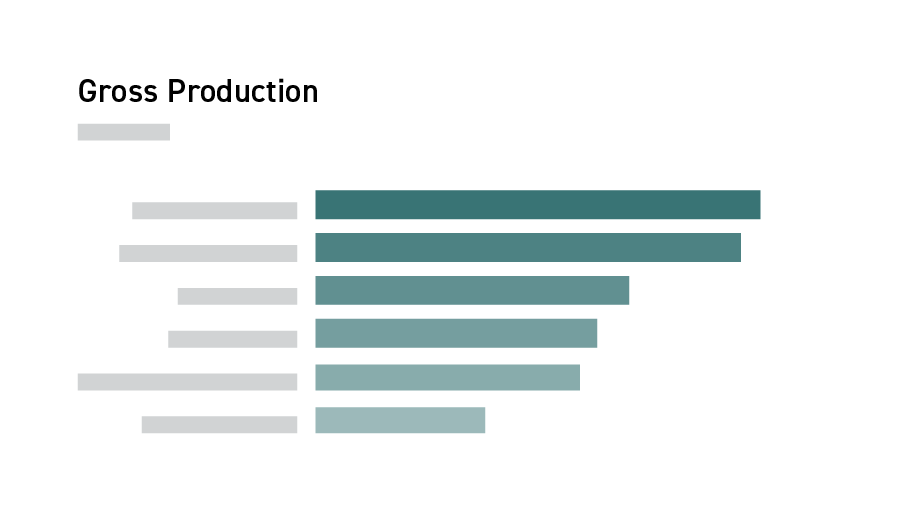
If you don’t know the answers to these questions, then setting projections for the practice can be incredibly difficult. But with the DataDx Provider Productivity Report, it really is easy, and your providers will feel even more invested in their day-to-day performance.
With DataDx, you and your providers can get real-time summaries of key performance indicators, like Gross Charges, Net Collections, Patients Seen, Days Worked, Work RVUs, and Total RVUs.
You can even customize your reports, and track performance by time, by provider, provider to provider, and more!
Visits
How much time are you able to spend on making sure your practice has a healthy new-to-existing patient ratio?
Remember, it not only costs more in marketing and patient education to bring on new patients vs. those already in your database, but if your existing patients aren’t coming back, then there’s something in your process that needs attention.
How are you using this information to make your practice, your team, and your delivery of care better?
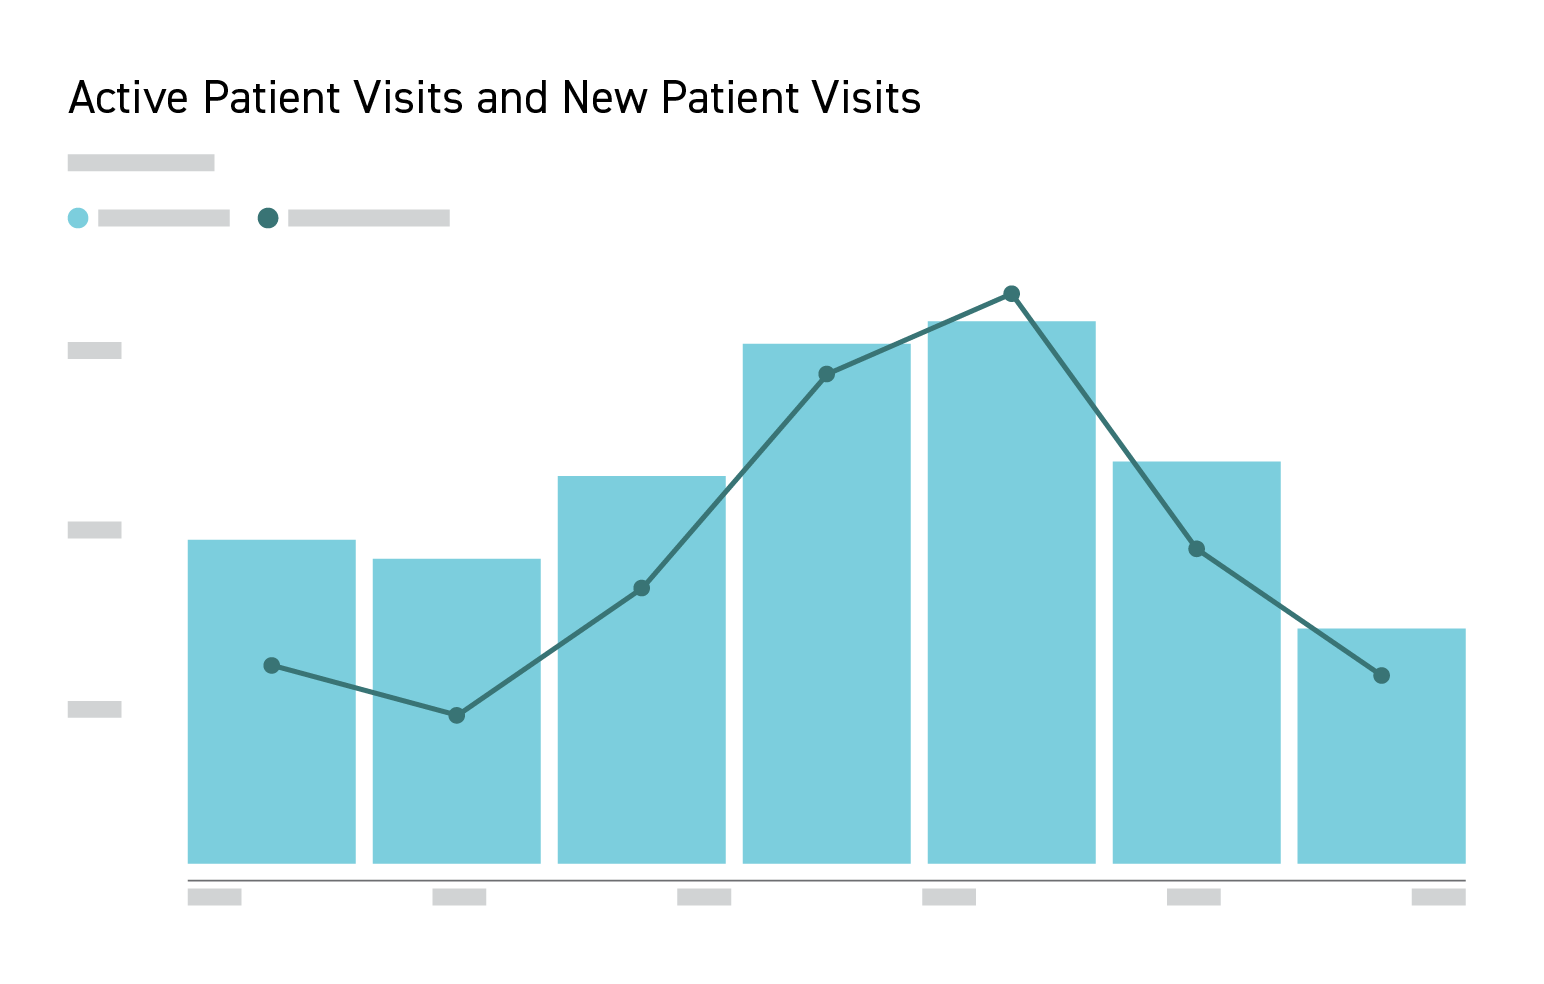
If you’re not, then you need the DataDx Visits Report. You’ll be able to closely track new patient visits, new vs. existing patients, no-charge visits, and your top 5 CPT codes across your new and existing patients.
You’ll no longer be left in the dark about what’s happening with your patient database, and your patients will no longer run the risk of falling through the cracks of a system in need of improvement.
Patients
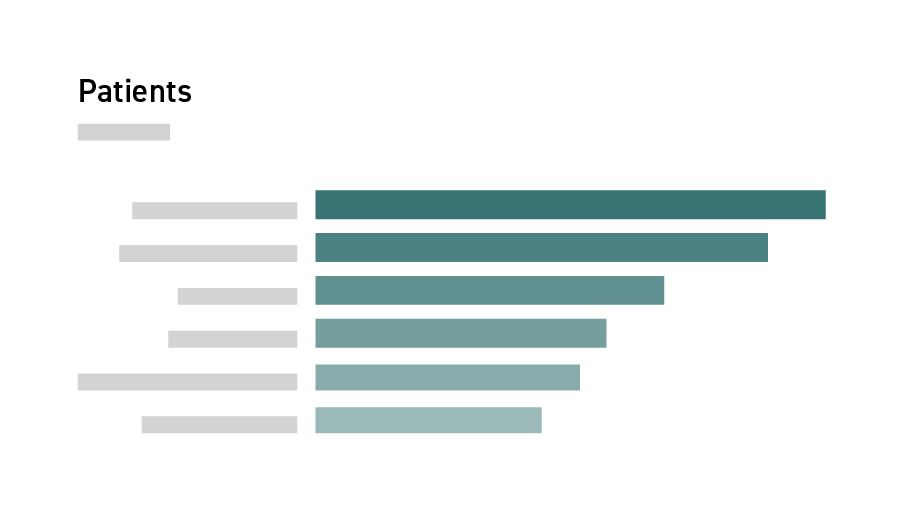
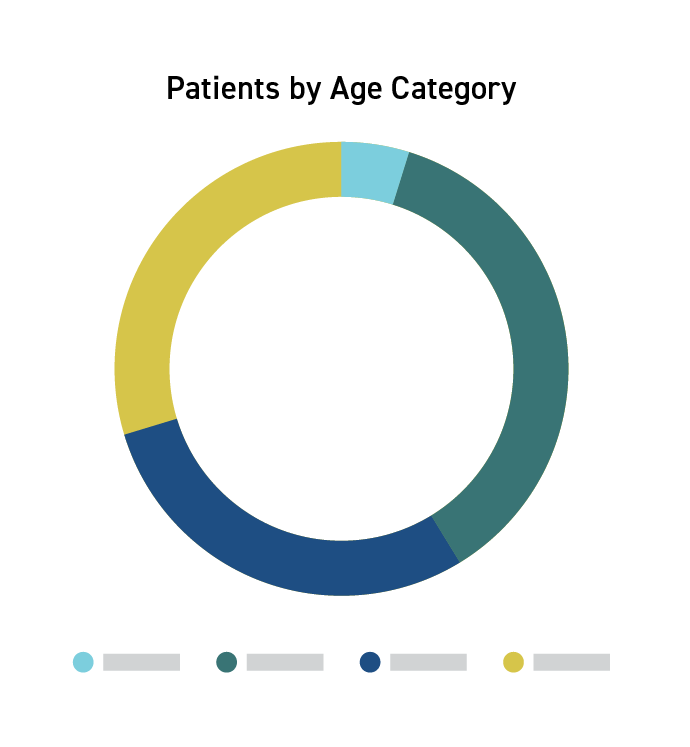
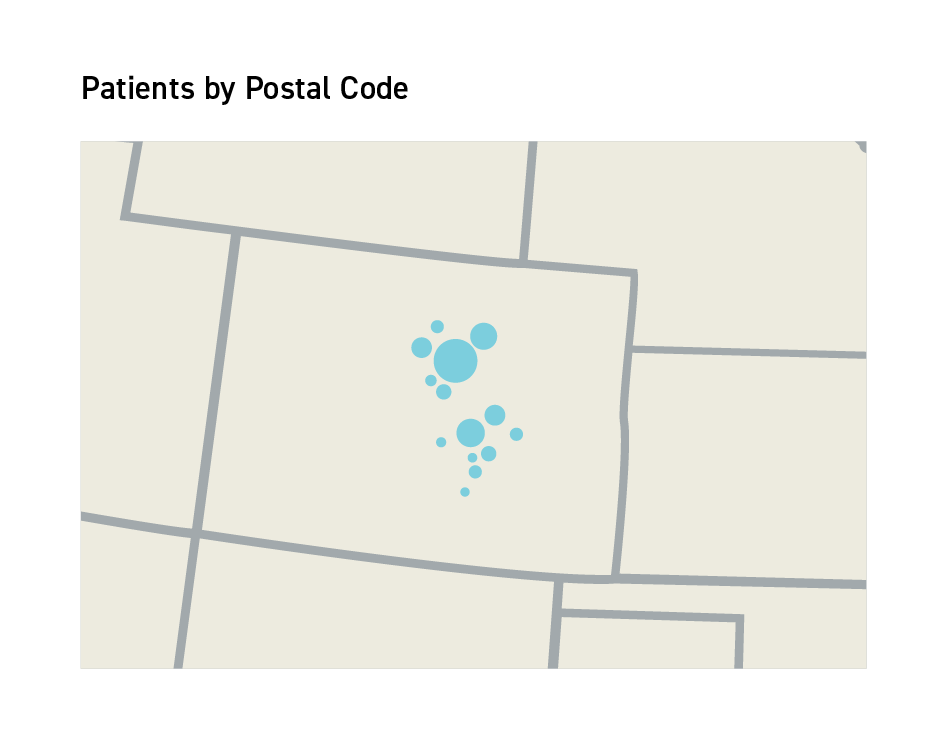
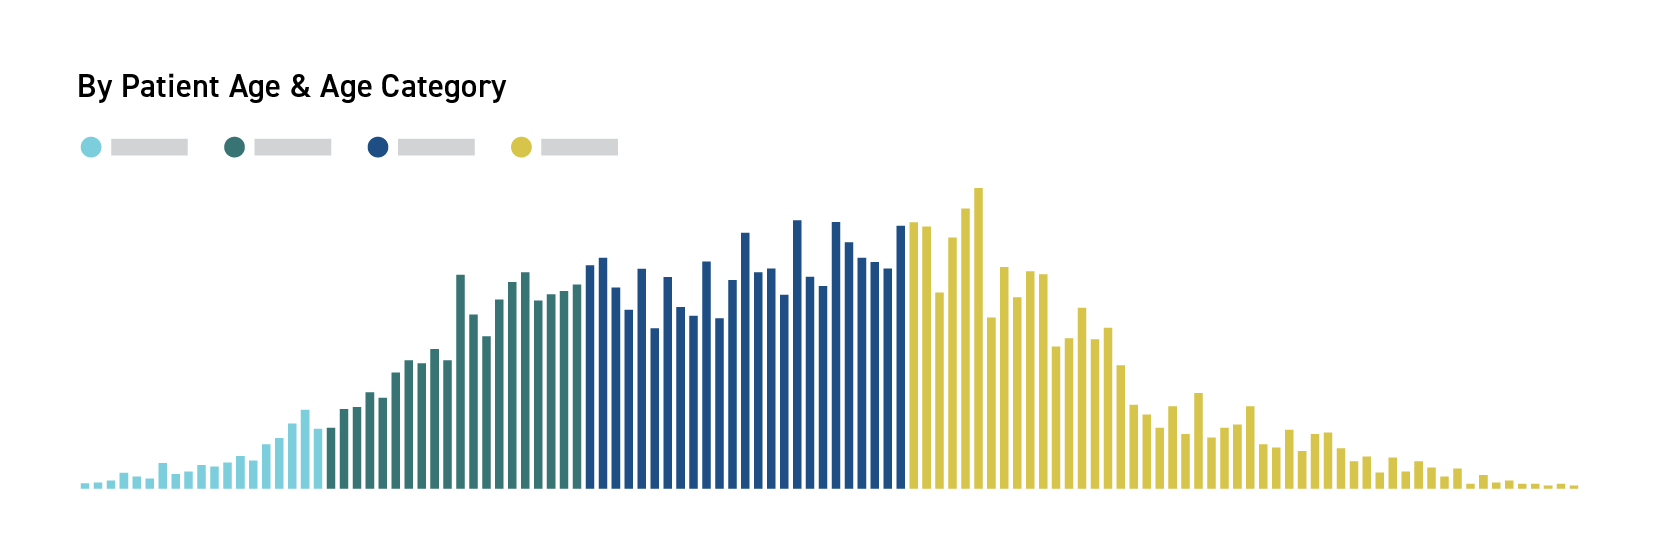
The DataDx Patients Report for Dentistry is a simple but powerful visualized report that organizes your patients’ age, zip code, treatment, date they were seen, as well as location, provider, specialty, and department data in order to give you both micro and macro views of health trends by region or location, patient load by provider, and much more.


